Posted with permission of BE Bearings
Table of Contents
Article Source: BE Bearings Wiki: http://wiki.rcollins.org/core/index.php/Oil_Flow_-_S65_Oil_Flow_Analysis
Overview
Test Vehicle
Data logging Equipment
Data signals collected and stored
Driving Styles
Test Definitions
Table of Contents
- Overview
- Test Vehicle
- Data logging Equipment
- Data signals collected and stored
- Driving Styles
- Everyday driving and hard cornering
- Track day driving
- Test Definitions
- Temperature, RPM, and Cold/Warm Start Ranges
- Temperature Graph Ranges
- RPM Ranges
- Cold Start Temperature Ranges
- Warm Start Temperature Ranges
- Cold/Warm Start Analysis
- Cold Start Analysis
- Warm Start Analysis
- Oil Pressure Analysis
- Oil Pressure in the S65
- Oil Pressure Tests
- Oil Flow Analysis
- About Oil Flow
- Measuring Oil Flow
- Oil Flow Tests
- Summary Oil Pressure, Oil Flow Analysis
- Summary Oil Pressure, Oil Flow Tests
- Temperature, RPM, and Cold/Warm Start Ranges
- Testing Results: BMW Factory 702/703 Bearings
- Overview
- Cold/Warm Start Analysis
- Cold/Warm Start Data
- Cold Start Graphs
- Warm Start Graphs
- Oil Pressure Analysis
- Average Oil Pressure at various temperatures vs. RPM
- RPM of minimum oil pressure (4-BAR, 58-PSI)
- Absolute Minimum Oil Pressure at various temperatures vs. RPM
- Absolute Maximum Oil Pressure at various temperatures vs. RPM
- Oil Flow Analysis
- How oil flow changes with different oil temperatures and RPM
- Average Oil Pressure and Oil Flow
Article Source: BE Bearings Wiki: http://wiki.rcollins.org/core/index.php/Oil_Flow_-_S65_Oil_Flow_Analysis
Overview
From the day BE Bearings was conceived, we knew we must figure out a way to test the bearings to ensure they caused no detrimental effects to the S65 engine. We also knew there wouldn’t be any perfect way to do this. We felt the most important thing to measure (oil flow) would also be the most difficult and most expensive. If our theories are correct about too little bearing clearance, then increasing the bearing clearance will show up as increased oil flow. But we had no idea how much, if any, that would be. From pricing the sensors, all we knew was that it was going to be expensive.
We also knew we needed to measure oil pressure to go along with oil flow. We could expect that increasing bearing clearance might decrease oil pressure. If oil flow increased, but oil pressure decreased substantially, that might be a danger to the rest of the engine.
But even if we can measure these things, how do we capture the data and save it? If you have the right equipment and knowledge, then all it takes is a little ingenuity to put together a very nice data logging platform that saves the results to SD Card. That’s where the vBox Pro comes in. The vBox Pro can data log the car’s engine CAN bus and everything on it (see “Data Signals Collected” below). But it still takes a little more equipment and ingenuity to capture the oil pressure and oil flow and add them to the list of signals seen by the vBox Pro. Both the oil flow sensor and our AEM oil pressure sensor will output their measurements as voltages. If we could capture these voltages and convert them to digital data, we’d have the ideal data logging set up. That’s where the vBox Mini Input Module comes to play.
The vBox Mini Input Module (MIM) converts analog signals (like voltages) to digital values, then broadcasts them on a CAN bus. In this case, we programmed the MIM to broadcast the signals on the engine CAN bus at addresses unused by vehicle (so they don’t interfere with anything). Once the signals appear on the engine CAN bus, we can simply use the vBox Pro to capture them, along with all the other engine signals, and store them on the vBox Pro SD Card. This all happens at 10 Hz (10 samples per second). It’s a very nice data logging rig!
Once all the technical details were worked out and we were convinced it would all work, we decided to buy that expensive oil flow sensor and other equipment to make it all happen. Hooking it all up was easier than we thought – it all worked right out of the box exactly like we theorized it should.
Once the data is collected, it is imported into an online database. Once in the database, it can be searched, sorted, and analyzed with a variety of computer programming techniques. That’s exactly who we find these graphs below sorted by oil temperature, throttle input, cold start analysis, etc. The analytical possibilities are virtually limitless. We will be happy to make this database available to download to anybody who wants to analyze the data themselves (you must be familiar with SQA databases and programming to use it).
Below we included what we believe are the most valuable data and graphs to show the difference between factory (OEM BMW) and BE Bearings. The car ran for a year on factory (BMW) bearings while data was collected. After running for a year on factory bearings, the rod bearings were swapped to BE Bearings and the whole data logging / data collection process was restarted.
Just as sure as we were that we needed to test our bearings, we were just as sure that nobody else (no other vendors) would do this or even care to do this level of product verification. We’re pretty sure the results below will prove our point.
We also knew we needed to measure oil pressure to go along with oil flow. We could expect that increasing bearing clearance might decrease oil pressure. If oil flow increased, but oil pressure decreased substantially, that might be a danger to the rest of the engine.
But even if we can measure these things, how do we capture the data and save it? If you have the right equipment and knowledge, then all it takes is a little ingenuity to put together a very nice data logging platform that saves the results to SD Card. That’s where the vBox Pro comes in. The vBox Pro can data log the car’s engine CAN bus and everything on it (see “Data Signals Collected” below). But it still takes a little more equipment and ingenuity to capture the oil pressure and oil flow and add them to the list of signals seen by the vBox Pro. Both the oil flow sensor and our AEM oil pressure sensor will output their measurements as voltages. If we could capture these voltages and convert them to digital data, we’d have the ideal data logging set up. That’s where the vBox Mini Input Module comes to play.
The vBox Mini Input Module (MIM) converts analog signals (like voltages) to digital values, then broadcasts them on a CAN bus. In this case, we programmed the MIM to broadcast the signals on the engine CAN bus at addresses unused by vehicle (so they don’t interfere with anything). Once the signals appear on the engine CAN bus, we can simply use the vBox Pro to capture them, along with all the other engine signals, and store them on the vBox Pro SD Card. This all happens at 10 Hz (10 samples per second). It’s a very nice data logging rig!
Once all the technical details were worked out and we were convinced it would all work, we decided to buy that expensive oil flow sensor and other equipment to make it all happen. Hooking it all up was easier than we thought – it all worked right out of the box exactly like we theorized it should.
Once the data is collected, it is imported into an online database. Once in the database, it can be searched, sorted, and analyzed with a variety of computer programming techniques. That’s exactly who we find these graphs below sorted by oil temperature, throttle input, cold start analysis, etc. The analytical possibilities are virtually limitless. We will be happy to make this database available to download to anybody who wants to analyze the data themselves (you must be familiar with SQA databases and programming to use it).
Below we included what we believe are the most valuable data and graphs to show the difference between factory (OEM BMW) and BE Bearings. The car ran for a year on factory (BMW) bearings while data was collected. After running for a year on factory bearings, the rod bearings were swapped to BE Bearings and the whole data logging / data collection process was restarted.
Just as sure as we were that we needed to test our bearings, we were just as sure that nobody else (no other vendors) would do this or even care to do this level of product verification. We’re pretty sure the results below will prove our point.
Test Vehicle
- 2008 BMW M3
- 100% stock engine with 30000 miles
- Stock ECU
- Stock exhaust
Data logging Equipment
- Racelogic Video Vbox Pro, 32-channels engine (ECU) CAN bus.
- Racelogic Mini Input Module. Eight channels A-D conversions, transffered via CAN to Video VBox Pro
- AEM oil pressure sensor. 0-10 BAR; 0-5V analog output to Racelogic Mini Input Module
- Flow Technologies Turbine Oil Flow Sensor. Oil temperature and oil viscosity corrected. Calibrated for Castrol TWS 10W60 oil. 0-15 Gallons Per Minute (GPM); 0-10V analog output to Racelogic Mini Input Module.
Data signals collected and stored
- Timestamp (GMT)
- Vehicle Latitude
- Vehicle Longitude
- Vehicle Elevation (terrain height)
- Vehicle Velocity
- Wheel Speed Sensors (LF, RF, LR, RR)
- BMW internal speedometer
- Odometer
- Brake pedal pressure
- Steering angle
- Fuel gauge
- Vehicle voltage
- Engine RPM
- Throttle position (% open)
- Ambient pressure
- Ambient temperature
- Water temperature
- Oil temperature
- Oil Flow (0-15 GPM)
- Oil Pressure (0-150 PSI)
Driving Styles
Everyday driving and hard cornering
Track day driving
Vehicle was driven as a daily driver. 27 miles to work in rush hour traffic each day. Hard corning when possible. Grocery getting and fast food runs when possible.
Attempt to hit max RPM whenever possible. This helps data log oil flow.
Attempt to hit max RPM whenever possible. This helps data log oil flow.
- Attempted to hit max RPM in 2nd gear each morning while getting on the freeway. This was my best and most consistent opportunity.
- Also hit max RPM whenever the opportunity presented itself. Starbucks runs on weekends were a good opportunity for a consistent high RPM runs on open road.
Track day driving
I would have liked to include at least one track day with each set of rod bearings, but that wasn’t possible. At the track day event with the factory 702/703 bearings, the car immediately went into limp mode on the first parade lap. We never were able to fix the issue on that day. It was eventually tracked down to bad seals on the throttle bodies and/or possible loose ground strap (both issues were present). Therefore, the track day never happened for the original 702/703 bearings.
Test Definitions
Temperature, RPM, and Cold/Warm Start Ranges
Cold/Warm Start Analysis
Oil Pressure Analysis
Oil Flow Analysis
Summary Oil Pressure, Oil Flow Analysis
Testing Results: BMW Factory 702/703 Bearings
For any given temperature range, a set of RPM ranges is defined for analysis. Any samples found within that temperature range, and RPM range are averaged. For mid RPM, tens of thousands, sometimes over one-hundred thousand samples will be averaged in a given temperature and RPM range. This method is intended to smooth out the results and limit the effect of outlying data.
Temperature Graph Ranges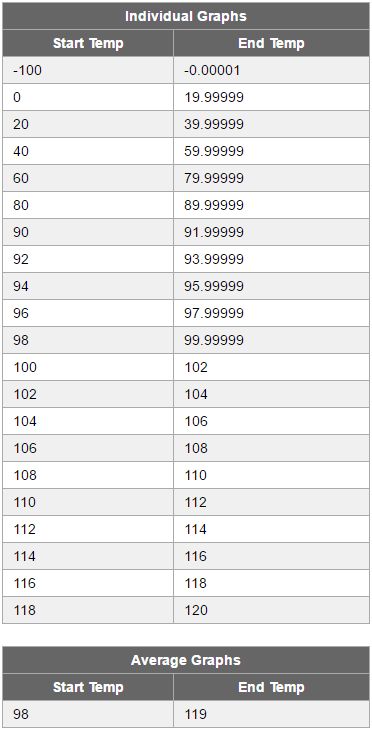
RPM Ranges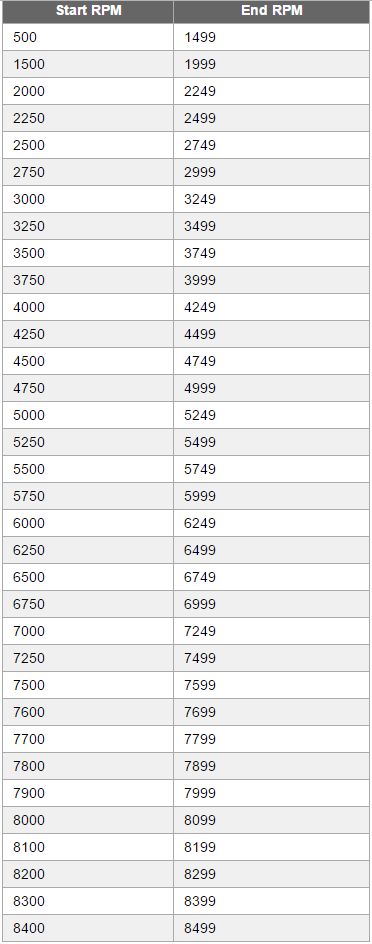
Cold Start Temperature Ranges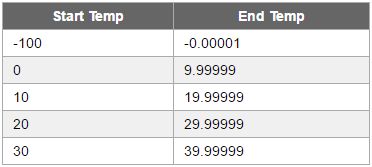
Warm Start Temperature Ranges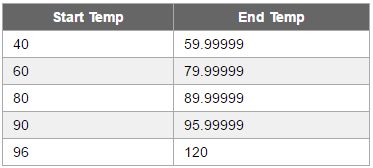
Temperature Graph Ranges
RPM Ranges
Cold Start Temperature Ranges
Warm Start Temperature Ranges
Cold/Warm Start Analysis
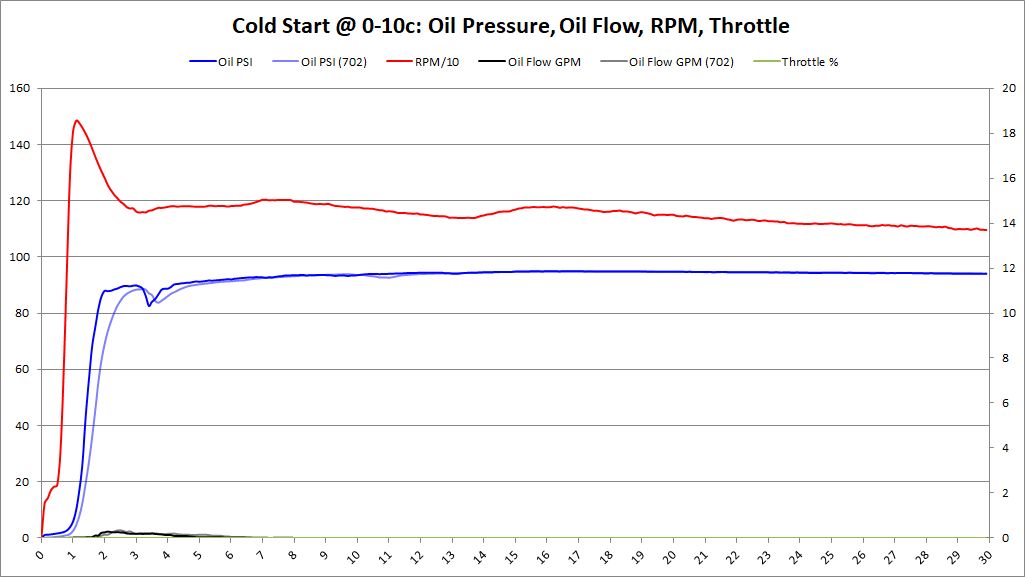
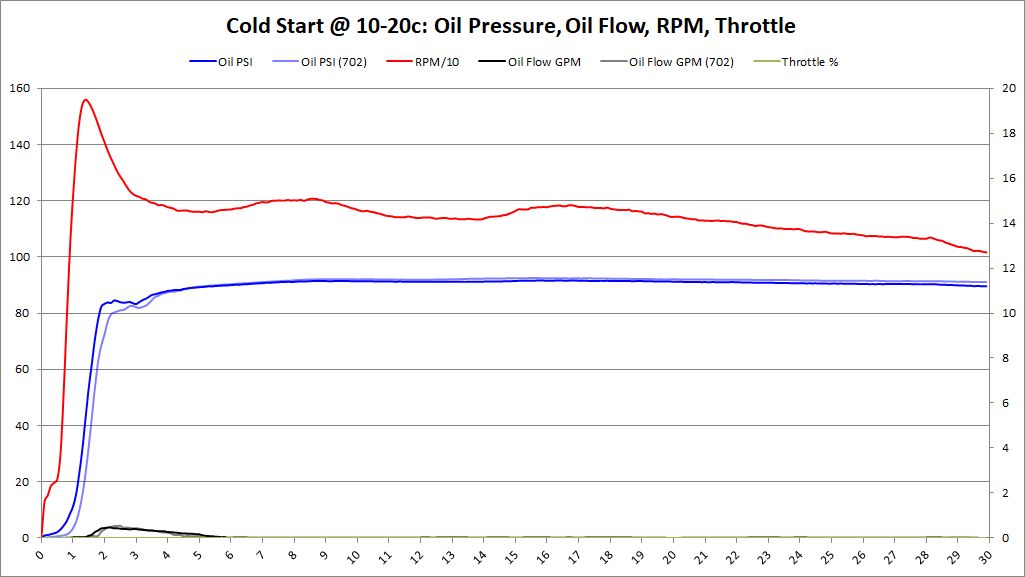
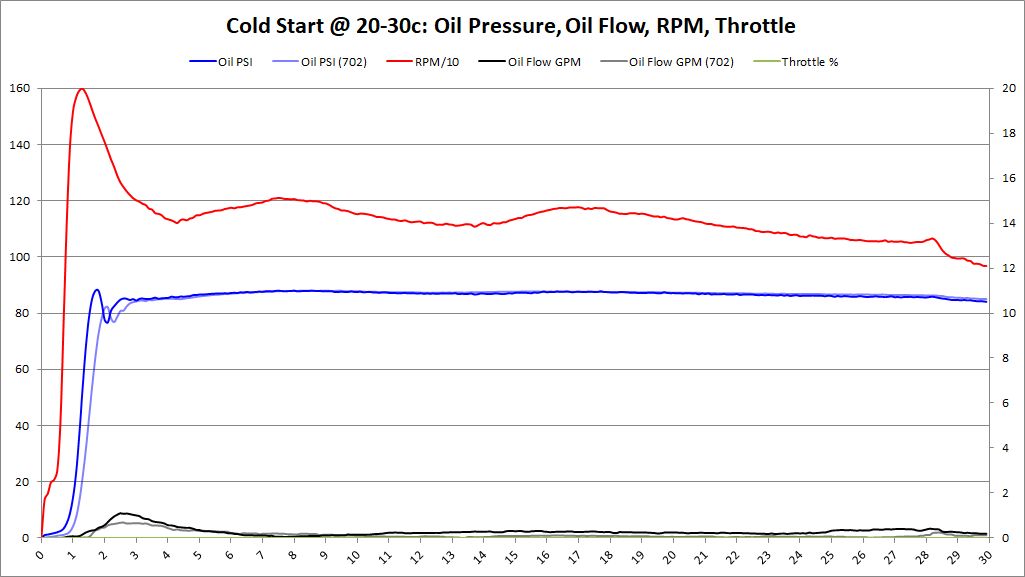
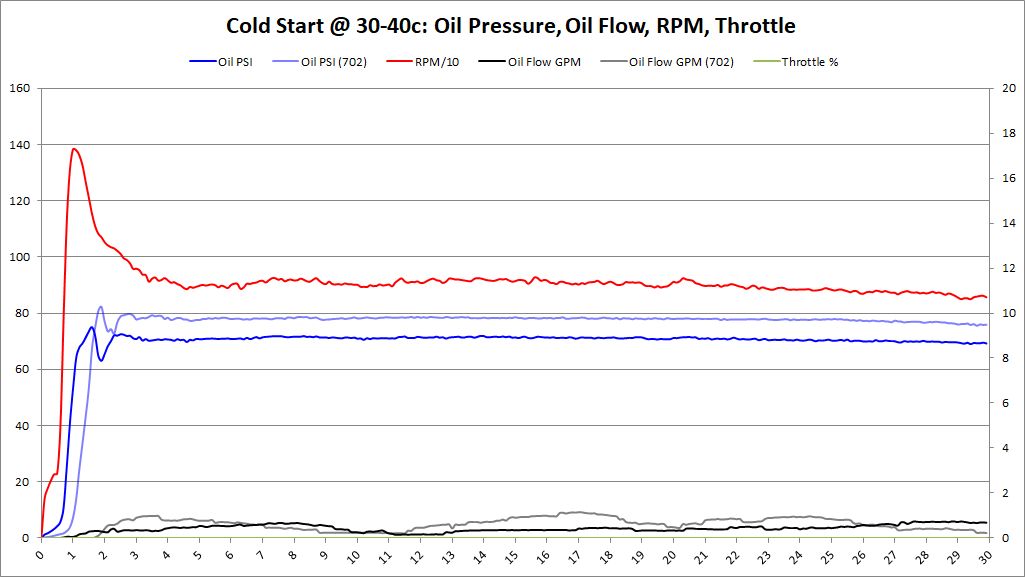
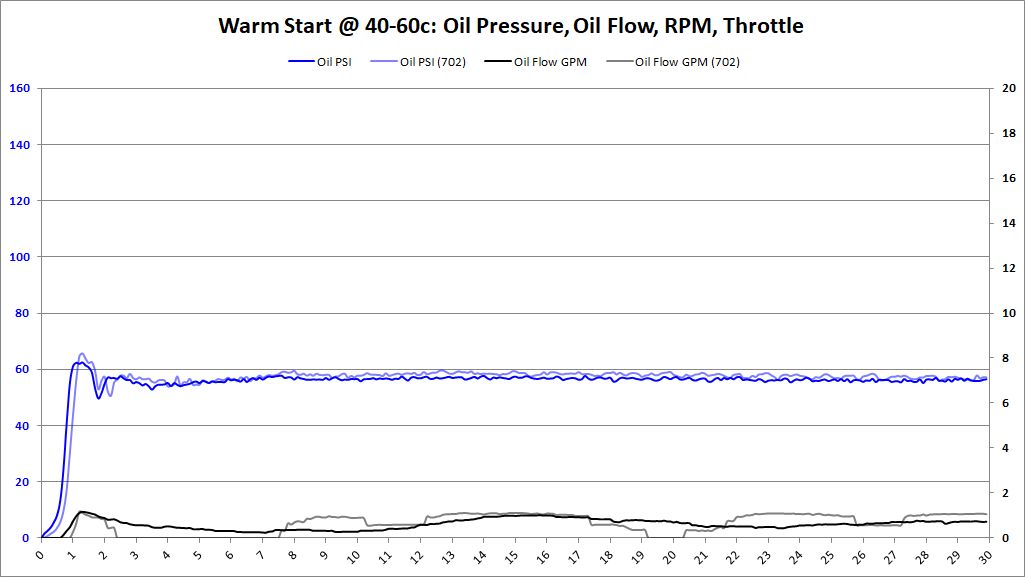
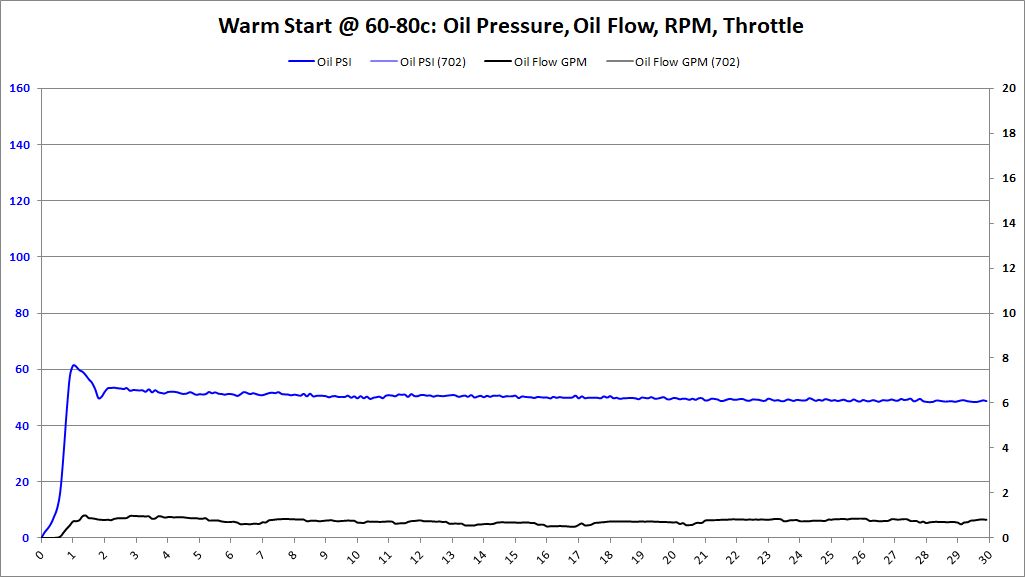
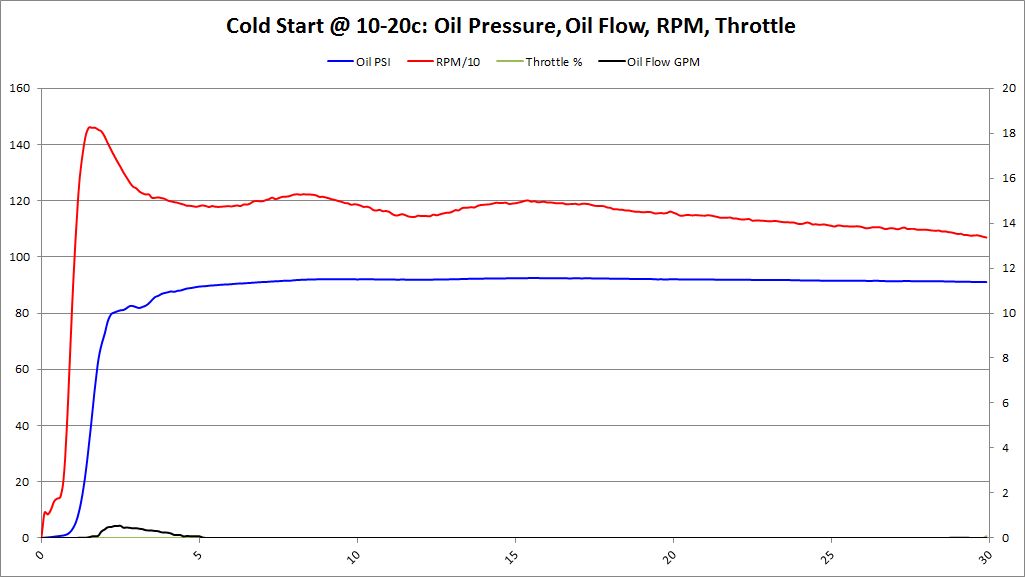
Once you start your car, have you ever wondered how long it takes for oil pressure to build and oil flow to start? This is the section that shows what it looks like.
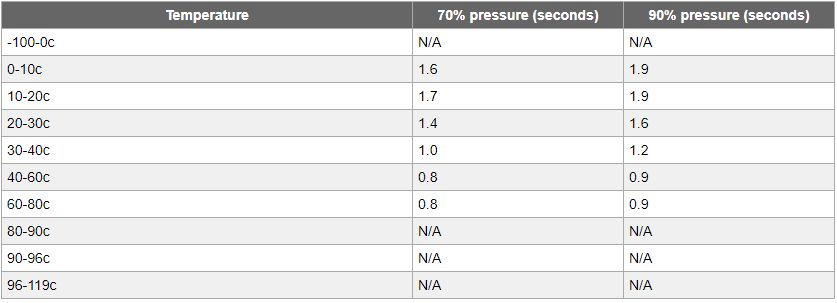
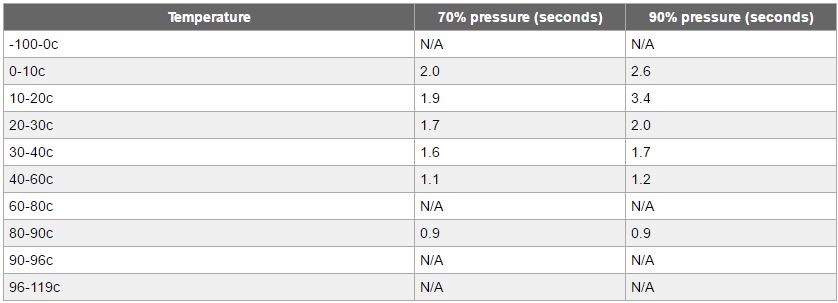
Charts and graphs will show what it looks like from the time you press the "START" button to 30-seconds later. The chart shows how long from “START” until 70% and 90% oil pressure is attained.
During testing of BMW factory 702/703 bearings, we discovered best results were obtained by pushing the start button, and letting the car idle for 30-seconds. Too many times during 702/703 bearing testing, we were in a hurry where we just started the car and drove off. This tended to skew the data collected.
While testing BE Bearings, an adjustment was made to let the car idle for 30-seconds after start. The net effect is that 702/703 data collection methods are slightly different. However, the 702/703 data will look better than it actually is. If the BE Bearing data shows better than factory, then it's a true results and not influenced by a "start-and-go" driving style we used on the 702/703 bearings.
Cold Start Analysis
Warm Start Analysis
Charts and graphs will show what it looks like from the time you press the "START" button to 30-seconds later. The chart shows how long from “START” until 70% and 90% oil pressure is attained.
During testing of BMW factory 702/703 bearings, we discovered best results were obtained by pushing the start button, and letting the car idle for 30-seconds. Too many times during 702/703 bearing testing, we were in a hurry where we just started the car and drove off. This tended to skew the data collected.
While testing BE Bearings, an adjustment was made to let the car idle for 30-seconds after start. The net effect is that 702/703 data collection methods are slightly different. However, the 702/703 data will look better than it actually is. If the BE Bearing data shows better than factory, then it's a true results and not influenced by a "start-and-go" driving style we used on the 702/703 bearings.
Cold Start Analysis
- Cold Start: Oil Temperature < 40 deg (C)
- Warm Start: Oil Temperature > 40 deg (C)
Oil Pressure Analysis
Oil Pressure in the S65
The factory oil pump is a variable displacement vane (variable pressure) oil pump.

Oil pressure in the S65 varies with temperature. This is expected because as the oil is colder, it is more viscous. As the oil heats up, it becomes less viscous and reduces the pressure.
If minimum oil operating oils pressure is 4-BAR (58 PSI), then data logs and graphs will show which RPM level achieves that minimum requirement. Again, that answer will depend on oil temperature – as colder oil is more viscous and produces more pressure.
Oil Pressure TestsOil pressure in the S65 varies with temperature. This is expected because as the oil is colder, it is more viscous. As the oil heats up, it becomes less viscous and reduces the pressure.
If minimum oil operating oils pressure is 4-BAR (58 PSI), then data logs and graphs will show which RPM level achieves that minimum requirement. Again, that answer will depend on oil temperature – as colder oil is more viscous and produces more pressure.
The following tests are presented in the Oil Pressure Analysis section:
- Average Oil Pressure: All data collected between at the Temperature Ranges listed above. The data within each RPM range is averaged. This is the best demonstration of long-term oil pressure behavior in the S65.
- Graphs are presented with 5%, 30%, and 50% throttle input.
- A chart is presented to show minimum RPM where min oil pressure (4-BAR, 58-PSI) is acheived.
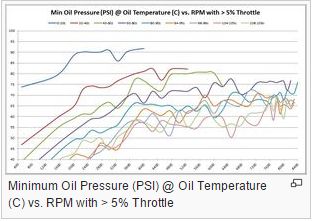
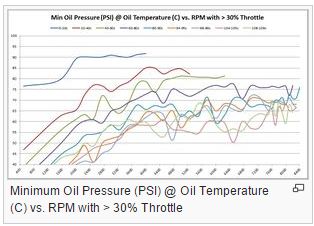
- Minimum Oil Pressure: This is interesting to see, but not terribly useful to draw meaningful conclusions. These are single samples, absolute minimums, of oil pressure over temperature and RPM. The one possible use might be to see how BE Bearings affect the absolute minimum oil pressure.
- Graphs are presented with 5%, 30%, and 50% throttle input.
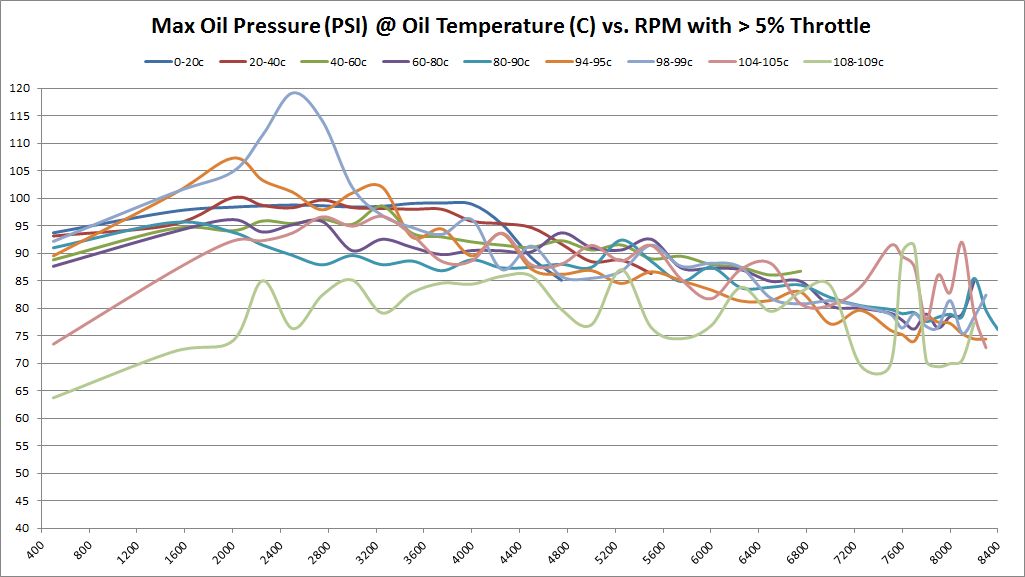
- Maximum Oil Pressure: This is the converse of minimum oil pressure. Again, not terribly useful, but interesting to see. The one possible use might be to see if BE Bearings have lower absolute maximum oil pressure measurements over factory bearings.
- A single graph is presented from 5% throttle input.
Oil Flow Analysis
About Oil Flow
Measuring Oil Flow
Oil Flow Tests
Why do we measure oil flow? There are a few important reasons we measure oil flow.
- Oil flow across the bearing surface is what keeps the bearings cool and reduces wear. When we change bearings from factory to BE Bearings with increased clearance, there may be a slight drop in oil pressure due to the larger bearing clearance. But oil pressure doesn’t tell the whole story. A modest decrease in oil pressure is not harmful; but we are hoping to see an increase in oil flow with BE Bearings. Establishing this baseline is important to BE Bearing analysis to see if the new bearings increase oil flow as hoped.
- Expanding on (1) above, measuring oil flow is a good way to gauge the difference caused by BE Bearings. By testing on the same engine, with the same oil, with same driver, who drives under the same driving conditions, and who drives in the in the same style, oil pressure and oil flow (specifically oil flow) will be the primary measurement change between factory and BE Bearings.
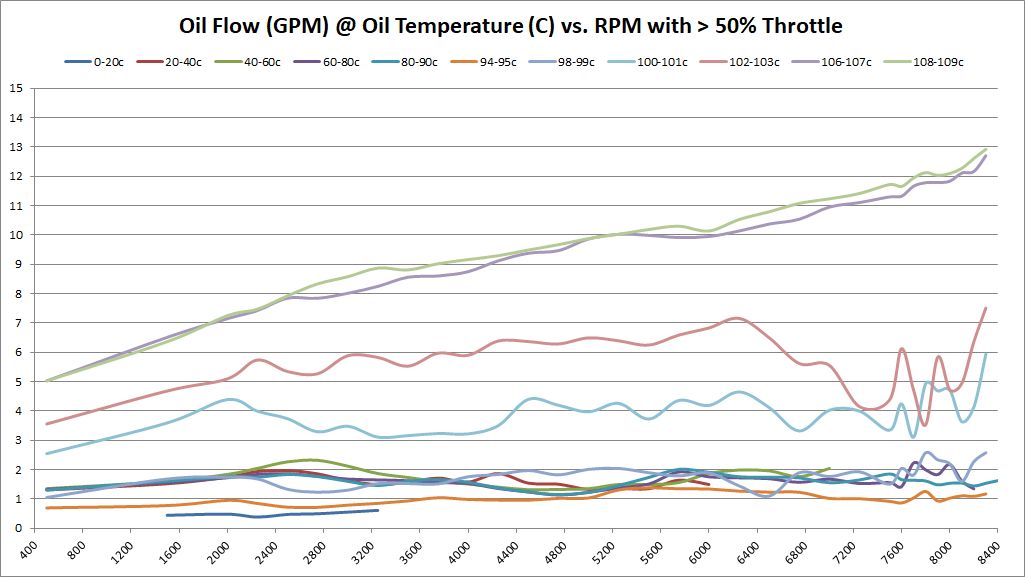
- As the engine heats up, the oil becomes less viscous. Increased oil flow is expected as the engine heats up. Since this data is totally unknown outside of BMW, we measure it and provide it for the community to share.
Measuring Oil Flow
Oil flow is measured with a Flow Technologies turbine flow meter between the engine oil filter outlet and oil cooler. This is the only place outside of the engine that the sensor could be placed. Oil flow to the cooler is thermostatically controlled. When the engine is cold, or just doesn’t feel like it, no oil is sent through the oil cooler – and thus not measured by the oil flow meter. Our programs used to measure and graph oil flow take this into account and ignore times when the thermostat is closed and not sending oil to the oil cooler.
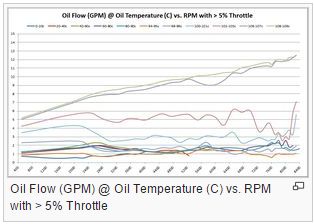
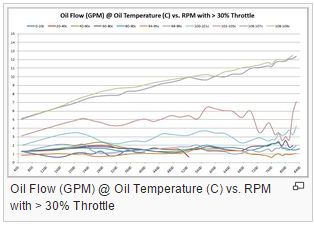
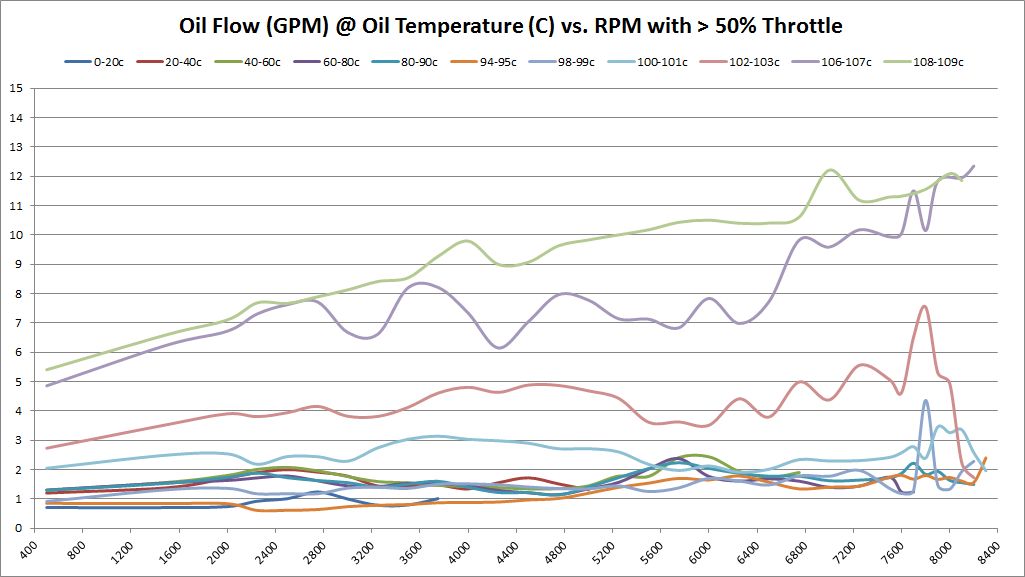
Oil flow in the S65 varies with temperature and RPM. Oil As you would expect, the higher the engine RPM, more oil flow will result. But a little less obvious, oil flow increases as the engine heats up. This is because the oil becomes less viscous with increased heat.
Oil flow in the S65 varies with temperature and RPM. Oil As you would expect, the higher the engine RPM, more oil flow will result. But a little less obvious, oil flow increases as the engine heats up. This is because the oil becomes less viscous with increased heat.
Oil Flow Tests
The following tests are presented in the Oil Pressure Analysis section:
- Average Oil Flow: All data collected between at the Temperature Ranges listed above. The data within each RPM range is averaged. This is the best demonstration of long-term oil flow behavior in the S65.
- Graphs are presented with 5%, 30%, and 50% throttle input.
Summary Oil Pressure, Oil Flow Analysis
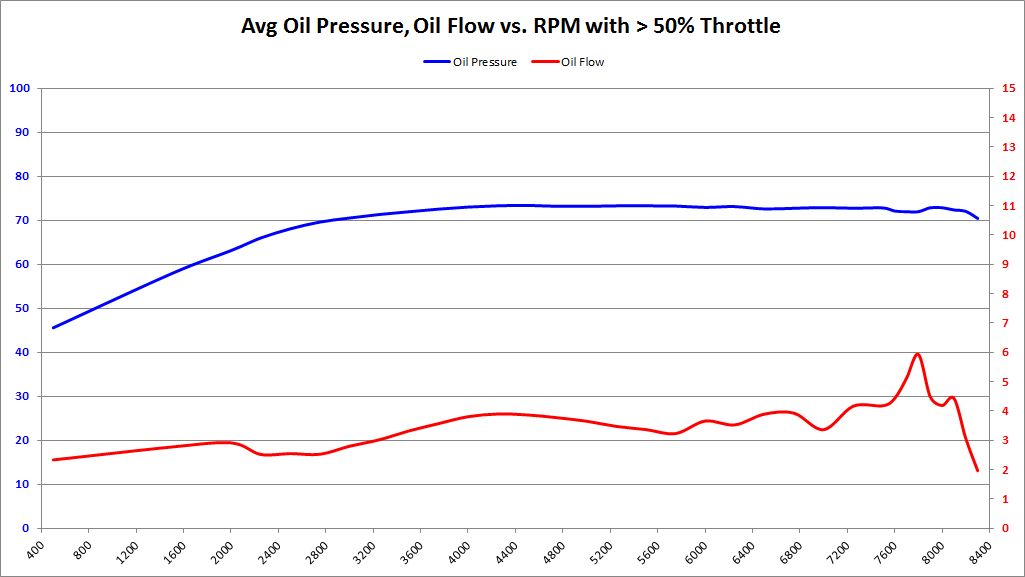
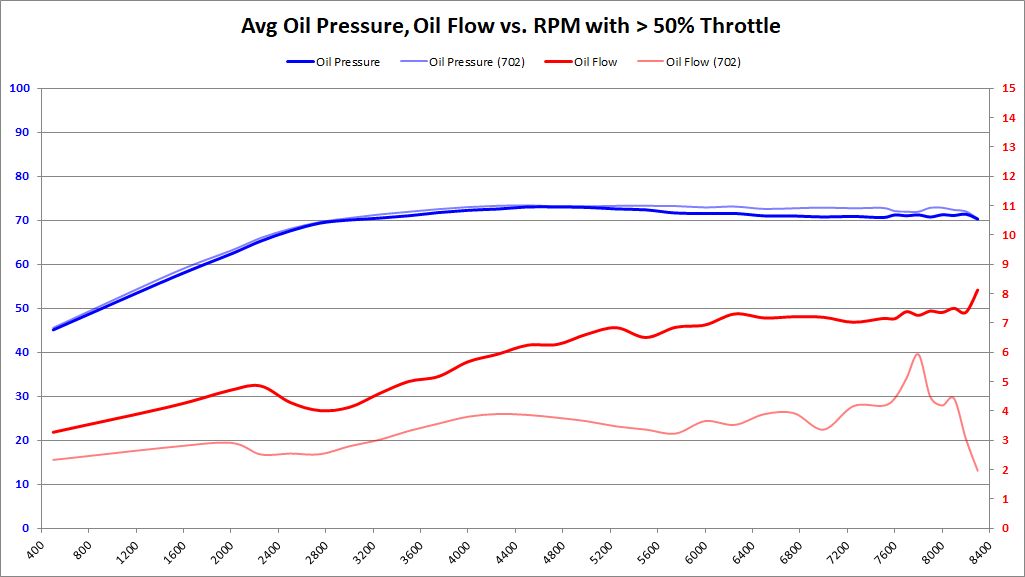
So what is the best way to roll up all of the data, and view it as a single graph? To me, this was best achieved by limiting the operating temperatures to 98-120 degrees-C. We can see how the S65 oil pressure and oil flow change with oil temperature and RPM. The oil flow graphs will show that oil flow stays relatively constant below 98c. At 98c, the oil pump has the most demands on it, and the oil thermostat is fully open. Even at 94-96c, I could see the oil thermostat closing for brief moments. This made 98-120c the best choice for rolling up all of the data. This will be the best apples-apples comparison between BMW factory bearings and bigger clearance BE Bearings. If average oil pressure changes, we'll see it in this graph. If average oil flow changes, we'll see it in this graph.
Summary Oil Pressure, Oil Flow Tests
Summary Oil Pressure, Oil Flow Tests
The following tests are presented in the summary oil pressure/oil flow analysis section:
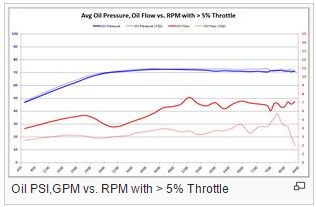
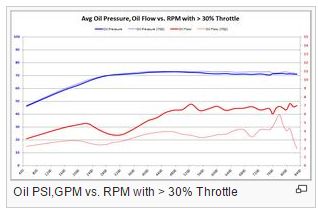
- Avg Oil Pressure, Oil Flow: All data collected between 98-119c. The data within each RPM range is averaged. This is the best demonstration showing the long term oil pressure and oil flow characteristics of the S65.
- Graphs are presented with 5%, 30%, and 50% throttle input.
Testing Results: BMW Factory 702/703 Bearings
Overview
Cold/Warm Start Analysis
Oil Pressure Analysis
Oil Flow Analysis
Average Oil Pressure and Oil Flow
Cold/Warm Start Analysis
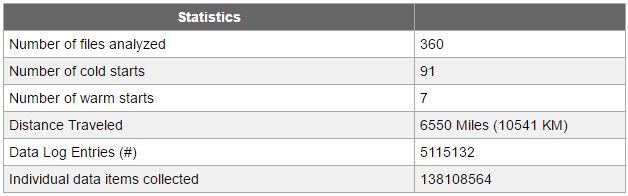
Cold/Warm Start Data
Cold Start Graphs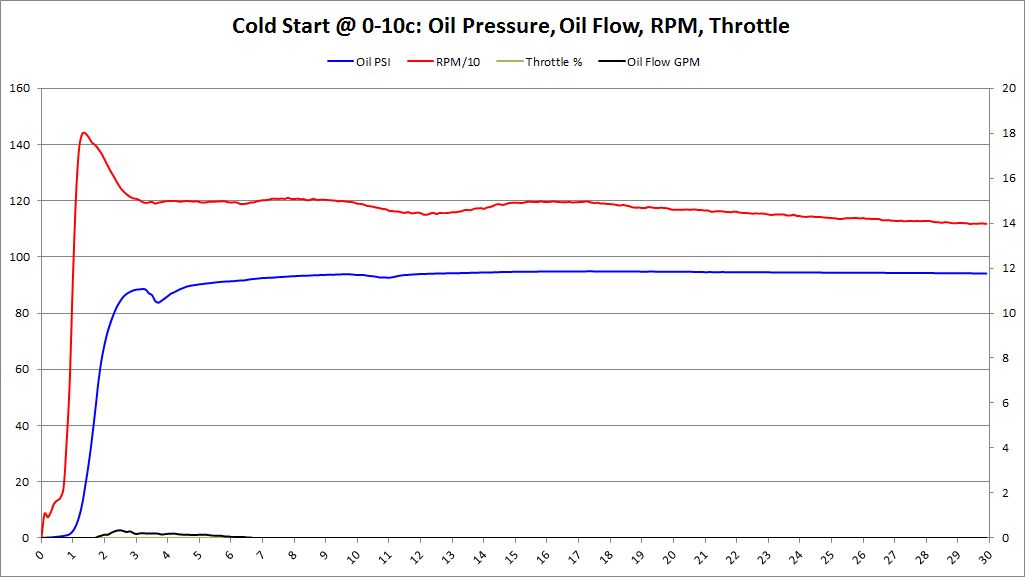
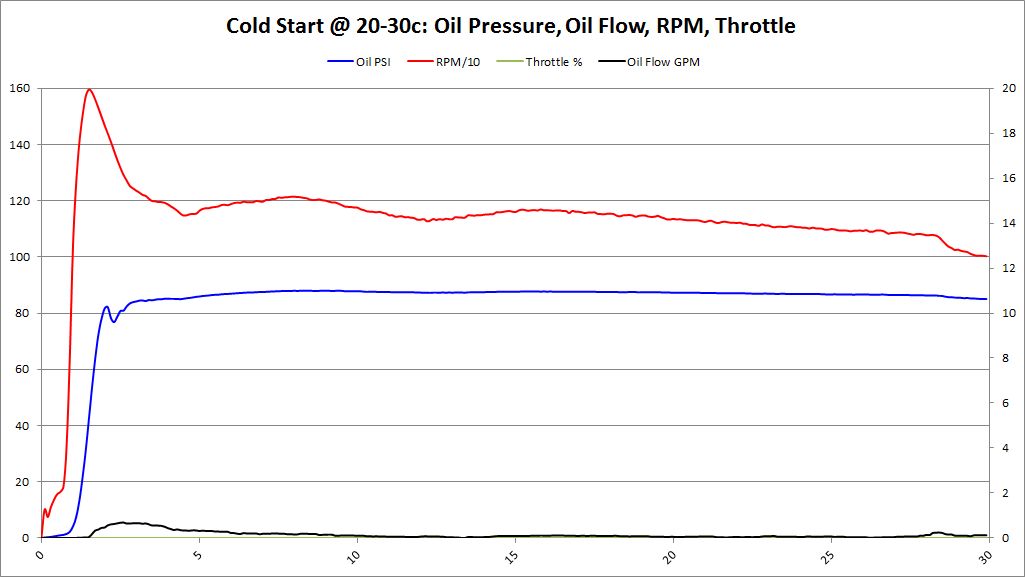
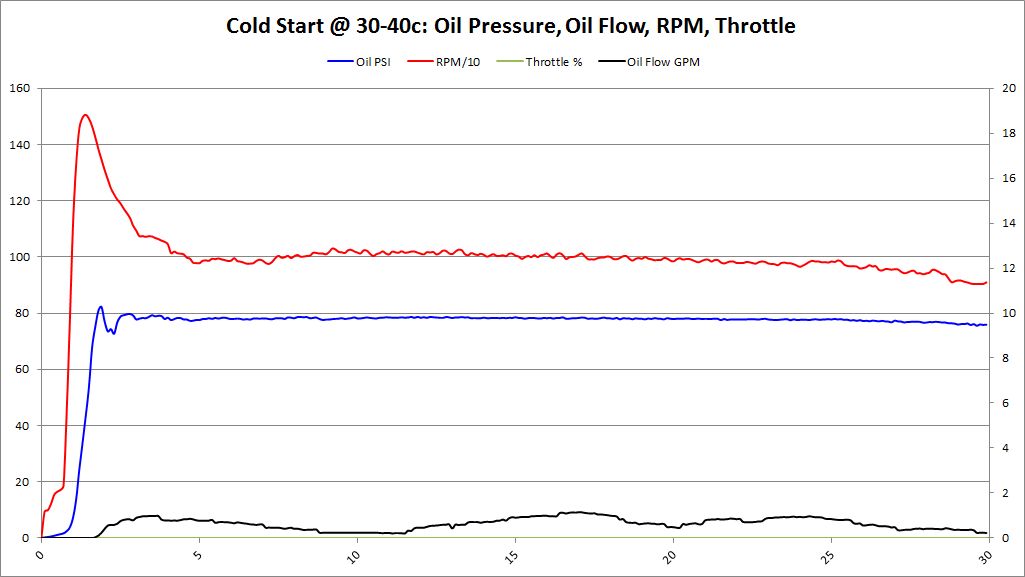 Warm Start Graphs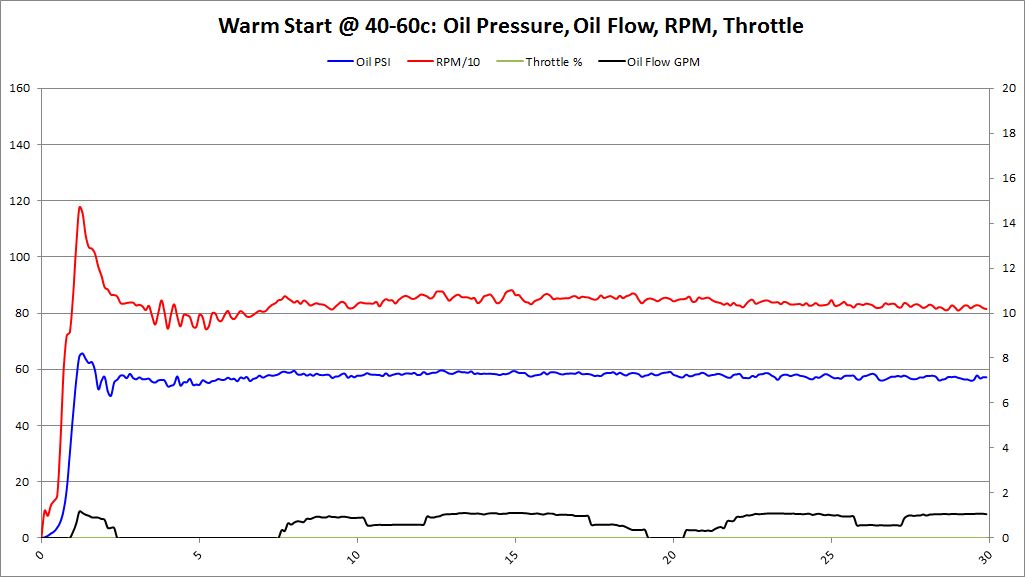
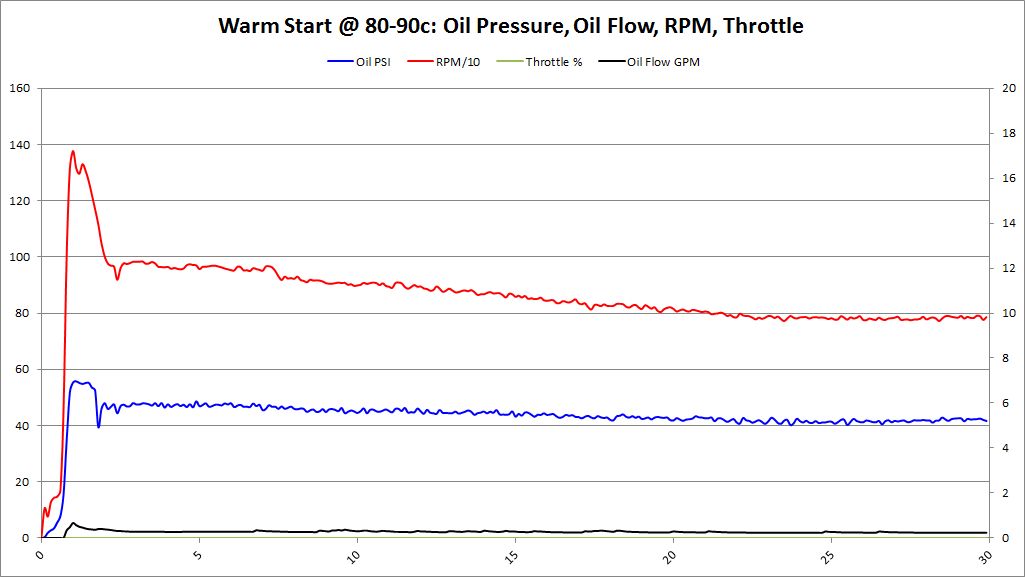
The following chart amd graphs will show what it looks like from the time you press the "START" button to 30-seconds later. The chart shows how long from “START” until 70% and 90% oil pressure is attained.
Cold Start Graphs
Oil Pressure Analysis
Average Oil Pressure at various temperatures vs. RPM
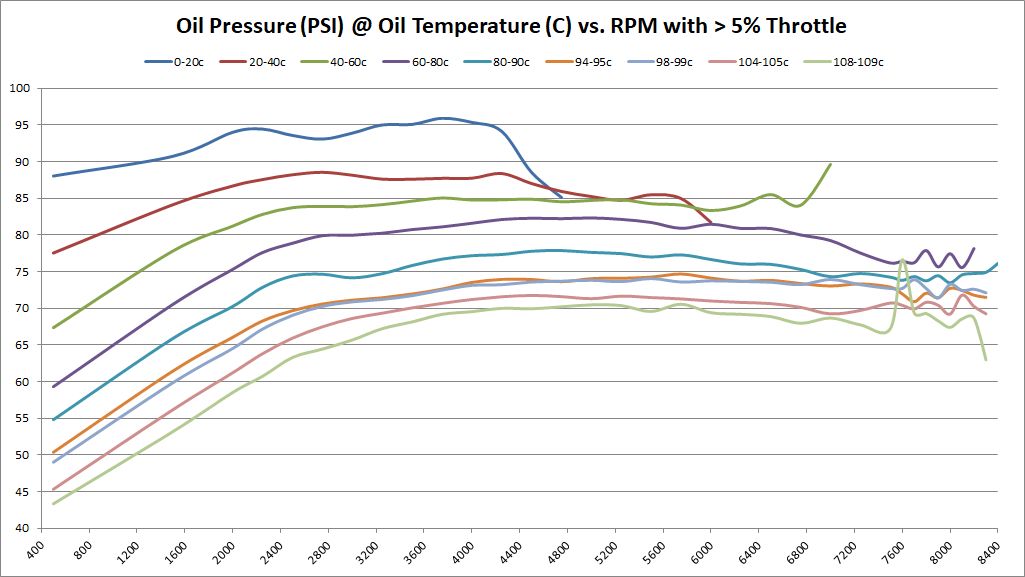
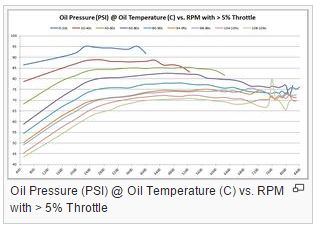
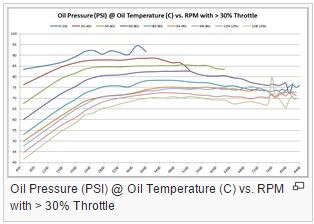
These graphs show the oil pressure average of all available samples at various temperatures and throttle ranges over RPM. The graphs do change slightly between 5%, 30%, and 50% throttle. The primary graph, 50% throttle is shown here. Click the thumbnails of the other graphs to enlarge each one.
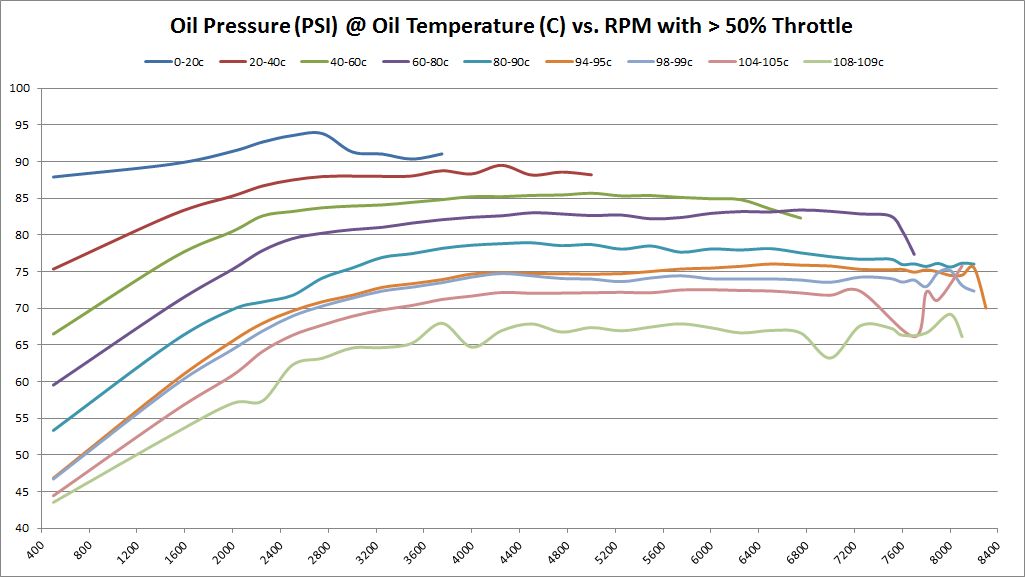
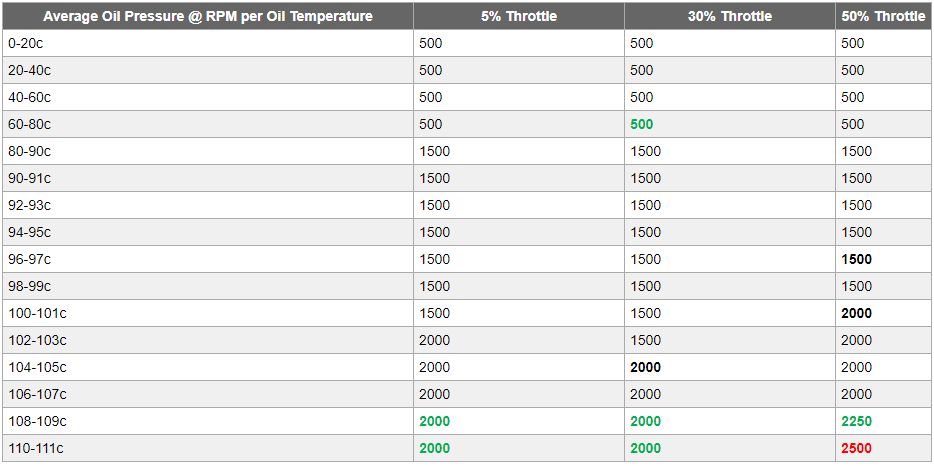
RPM of minimum oil pressure (4-BAR, 58-PSI) If minimum oil operating oils pressure is 4-BAR (58 PSI), then it’s interesting to see on this graph at what RPM that goal is achieved. Again, that answer depends on oil temperature – as oil is more viscous and produces more pressure the colder it is. As these graphs show, the minimum operating oil pressure at minimum RPM appears to be right around 2500; that’s where we get minimum 4-bar pressure regardless of oil temperature.
The following chart shows average oil pressure vs. RPM. It shows what RPM achieves minimum recommended 4-BAR (58-PSI) oil pressure.
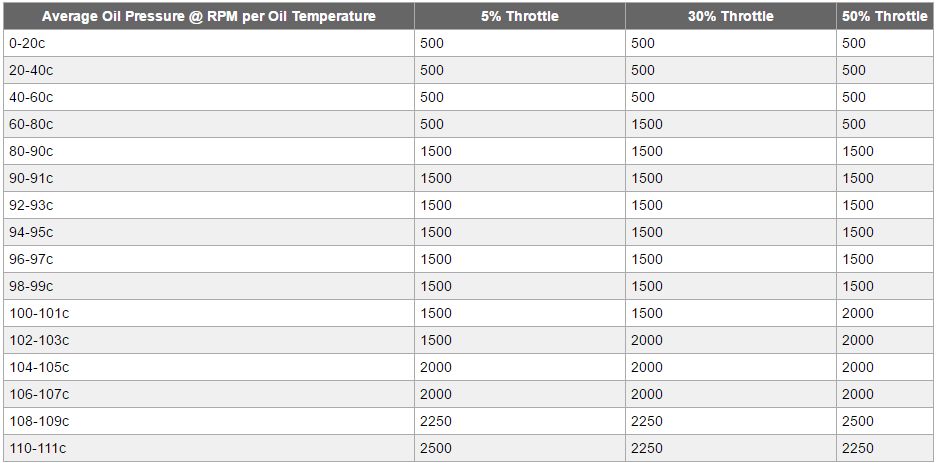
Absolute Minimum Oil Pressure at various temperatures vs. RPMThe following chart shows average oil pressure vs. RPM. It shows what RPM achieves minimum recommended 4-BAR (58-PSI) oil pressure.
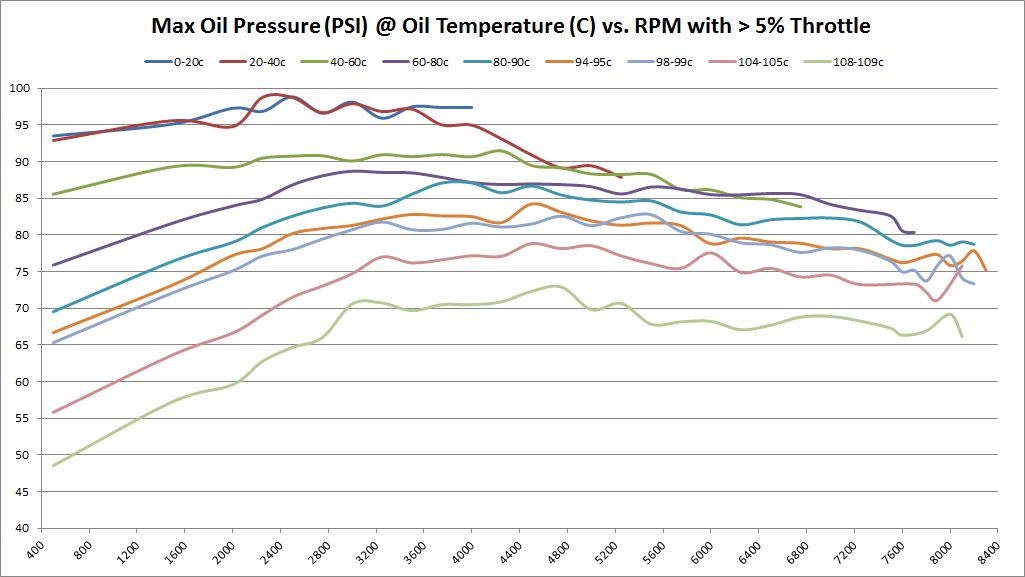
So far, the data being shown are averages across millions of samples. But what about absolute minimum and absolute maximums?
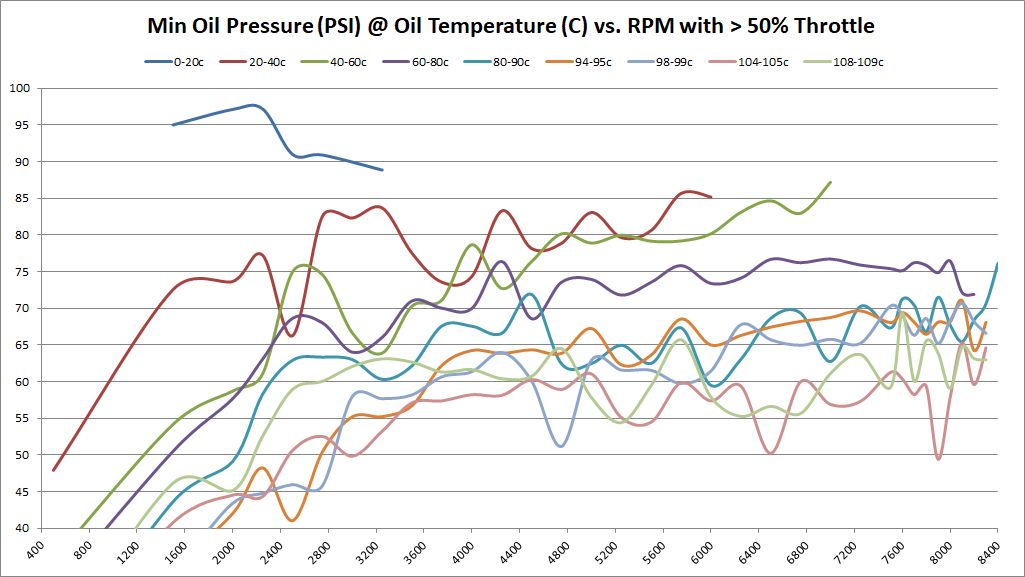
These are the same set of graphs as above, but show the absolute minimums. The absolute minimums are the minimum oil pressures collected across all temperature ranges. They are graphed here to show just how low the pressure can go. Some of this may have been observed during hard cornering (more on that later). So it's hard to draw any hard conclusions based on these graphs. They are offered for informational purposes only to let the reader draw their own conclusions.
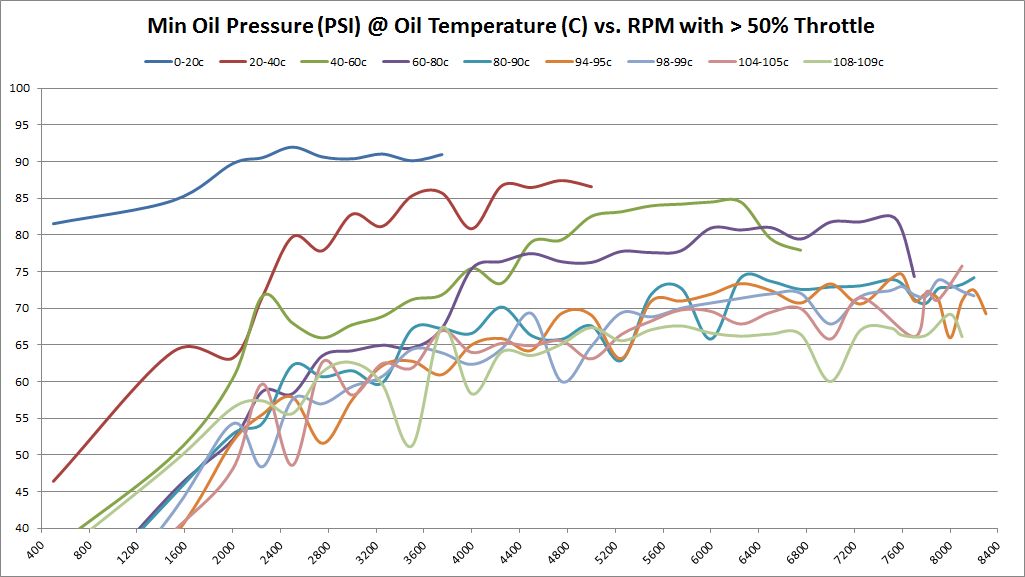
Absolute Maximum Oil Pressure at various temperatures vs. RPMThese are the same set of graphs as above, but show the absolute minimums. The absolute minimums are the minimum oil pressures collected across all temperature ranges. They are graphed here to show just how low the pressure can go. Some of this may have been observed during hard cornering (more on that later). So it's hard to draw any hard conclusions based on these graphs. They are offered for informational purposes only to let the reader draw their own conclusions.
Conversely, the final graph in this set shows the absolute maximums. There's no need to show maximum graphs for different throttle levels because the maximums are absolute and every graph would be the same.
Oil Flow Analysis
How oil flow changes with different oil temperatures and RPM
Average Oil Pressure and Oil Flow
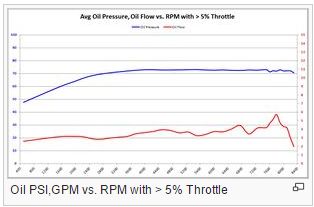
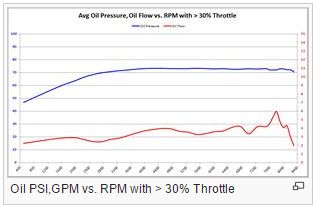
These graphs show the average oil pressure and average oil flow average of all samples between 98-119c, and throttle ranges over RPM. The graphs do change slightly between 5%, 30%, and 50% throttle. The primary graph, 50% throttle is shown here. Click the thumbnails of the other graphs to enlarge each one.